14 Z-score Basics
Jenna Lehmann
Standardized Distributions
Sometimes when working with data sets, we want to have the scores on the distribution standardized. Essentially, this means that we convert scores from a distribution so that they fit into a model that can be used to compare and contrast distributions from different works. For example, if you have a distribution of scores that show the temperature each day over the summer in Boston, it may be recorded in Fahrenheit. Someone else in Paris may have recorded their summer temperatures as well but in Celcius. If we wanted to compare these distributions of scores based on their descriptive statistics, we may want to convert them to the same standardized unit of measurement.
Standardized distributions have one single unit of measurement. Raw scores are transformed into this standardized unit of measurement to be compared to one another. Ultimately, they should look just like the original distribution, the only difference is that the scores have been placed on a different unit of measurement.
Z-Scores
Z-scores are the most common standardized score. They are used to describe score location in a distribution (descriptive statistics) and because we can compare scores across distributions, we can look at the relative standing of a score in a sample or a sample in a population (inferential statistics). The equation is
![\[ Z=\frac{(X - \mu)}{\sigma} \]](https://ubalt.pressbooks.pub/app/uploads/quicklatex/quicklatex.com-92f2619360b40d1f4d5bb312cbee9981_l3.png "Rendered by QuickLaTeX.com")
In this equation,  is the z-score,
  is the variable you want to convert,
  is the mean of the original distribution, and
  is the standard deviation of the original distribution.
So, what are the characteristics of a z-score/distributions? In a z-score the mean is placed at 0 and each number below or above is a representation of how many standard deviations away a score is. A 1 represents one standard deviation above the mean and -1 represents one standard deviation below the mean. For example, if I know that my original mean is 10 and my original standard deviation is 2, I know that a z-score of 1 would mean 12 and a z-score of -1 would mean 8. For the purposes of your class, all z-score distributions are normal distributions. Z-scores aren’t used on other kinds of distributions because the charts and proportions are designed to describe normal distributions.

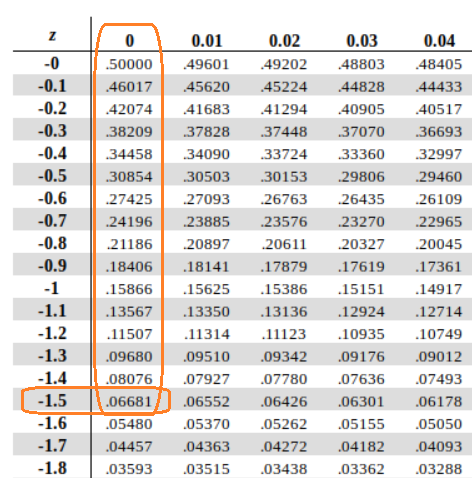
What’s nice about z-scores is that they can also be used to find proportions, which will be talked about even more in the next post. This requires the Unit Normal Table which is a table designed to help one translate z-scores into proportions of the population on either side of the score or compared to the mean score. There are 4 columns: one with the z-scores, one with the proportion of the population in the body of the distribution with the z-score as the starting point, one with the proportion of the population in the tail of the distribution with the z-score as the starting point, and one with the proportion of the population between the z-score and the mean. It can usually be found in the back of any statistics textbook. If I have a z-score of -1.5 and I wanted to know the proportion of the scores which are lower than -1.5, I could go to the back of my textbook, find -1.50 in the margins, and get the proportion .06681, meaning that 6.6881% of the data is less than a z-score of -1.5. The numbers in this table show the reader the proportion of everything to the left of the z-score in question. If I wanted to know everything to the right, the proportion would be 1 – 0.06681, which is .93319 or 93.319% of the data.
Z-scores can be used in inferential statistics. Interpretation of research results depends on determining if the (treated) sample is noticeably different from the population. The distribution of the general population would describe the average untreated person, so this allows researchers to compare that distribution to their treated sample. Z-scores are one technique for defining “noticeably different”, but it more like borders on inferential statistics, because we can’t actually tell if there’s a statistical difference without running the right test. Z-tests and their purpose in inferential statistics will be discussed in other posts.
This chapter was originally posted to the Math Support Center blog at the University of Baltimore on June 6, 2019.
