2 Descriptive Statistics
Jenna Lehmann
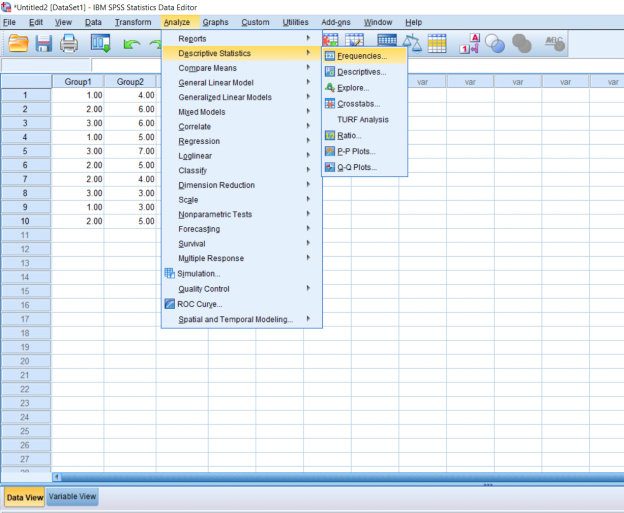
Sometimes you’ll want to get some basic information on the data you have. Running these descriptive statistics is pretty straight forward. First, click the Analyze button, hover over the Descriptive Statistics tab, and then you’ll be able to choose a few different options. I prefer just clicking the frequencies button because it gives you the option to look at frequencies as well as other kinds of descriptives.
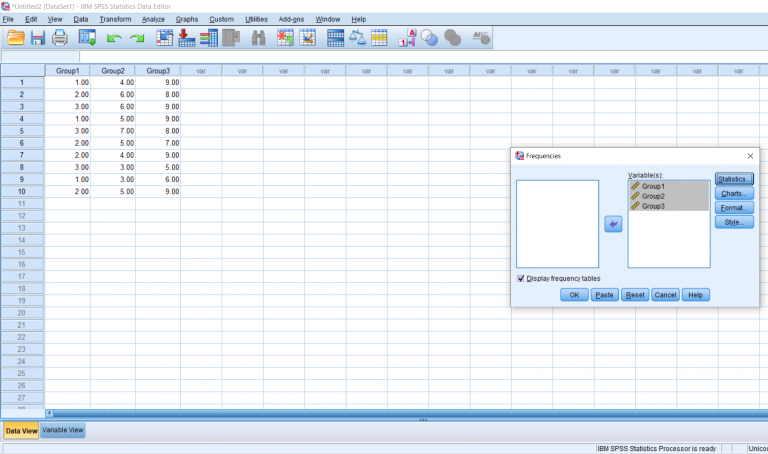
After clicking that, a pop-up will appear. Highlight the groups you would like descriptives and frequencies on and move them over to the right.
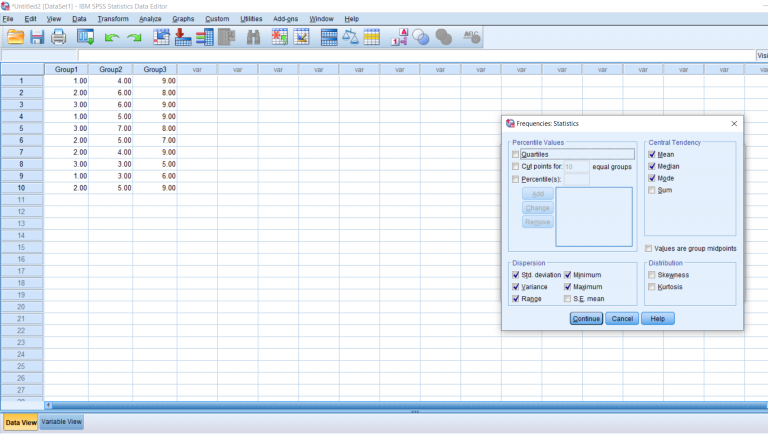
To get the descriptive data we want, click the Statistics button. You can choose from a variety of different descriptives. I like getting all the measures of central tendency and everything related to variability, but as you can see there are other options as well.
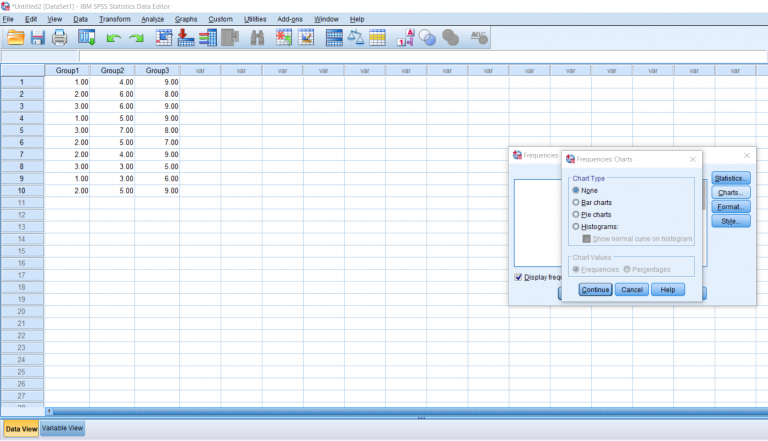
After clicking out of that, you can then have SPSS make you a chart or a graph by clicking the Charts button. I decided not to go ahead with that, but I wanted to point out that option. There are some other buttons to click, but I personally have never needed to mess with those.
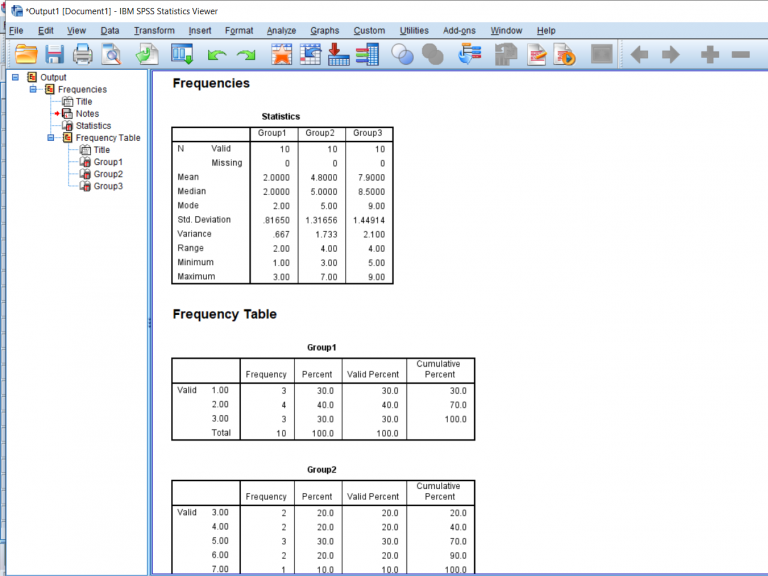
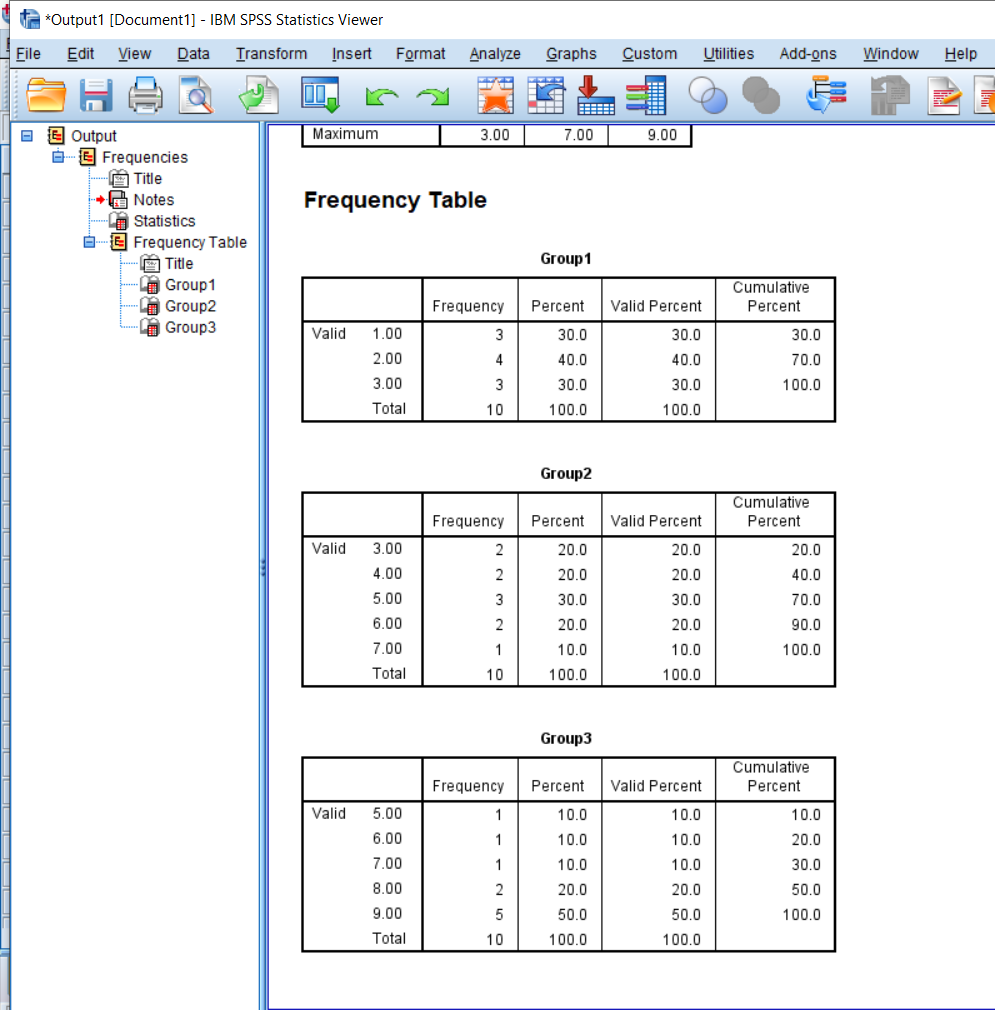
Once you finish with the pop-up, the output should appear on a separate window. These are screenshots of what my data looked like. This output is pretty easy to read because it’ll just tell you what you asked to know. Other outputs may be more difficult to read so in future posts I’ll go into detail about what it is you’ll be looking at.
This chapter was originally posted to the Math Support Center blog at the University of Baltimore on July 1, 2019.
