3 Comparing Means: Single Sample t-test
Jenna Lehmann
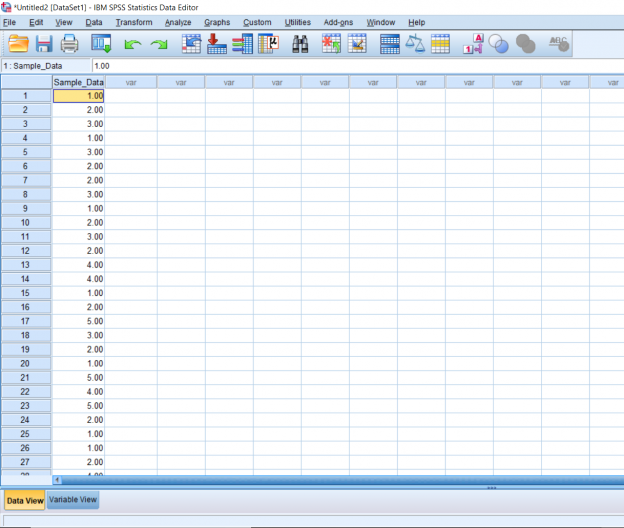
With a one-sample t-test, we only need to worry about working with one sample. When starting, you should already know the population mean you’ll be comparing the sample to. So in this first picture, we have one column of data lined up and ready to go.
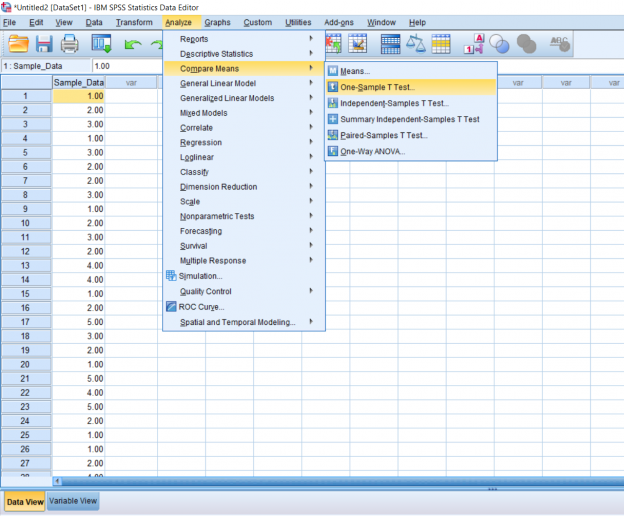
The next step is to click the Analyze button, hover over Compare Means, and click One-Sample T-Test.
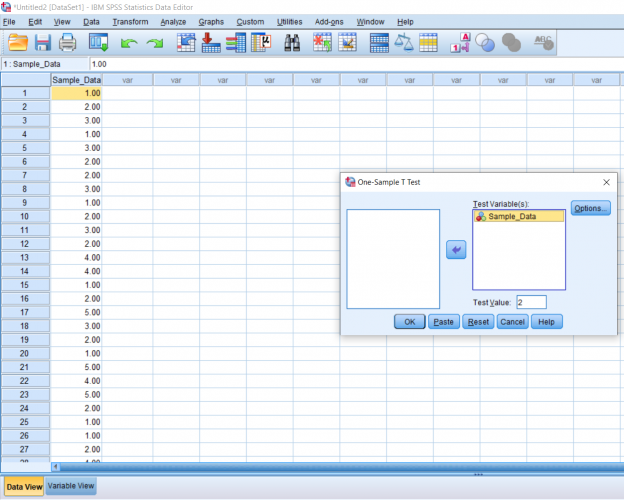
A pop-up should appear. Simply move the name of your test variable to the right. In the Test Variable, type in the population mean you would like to compare the sample to.
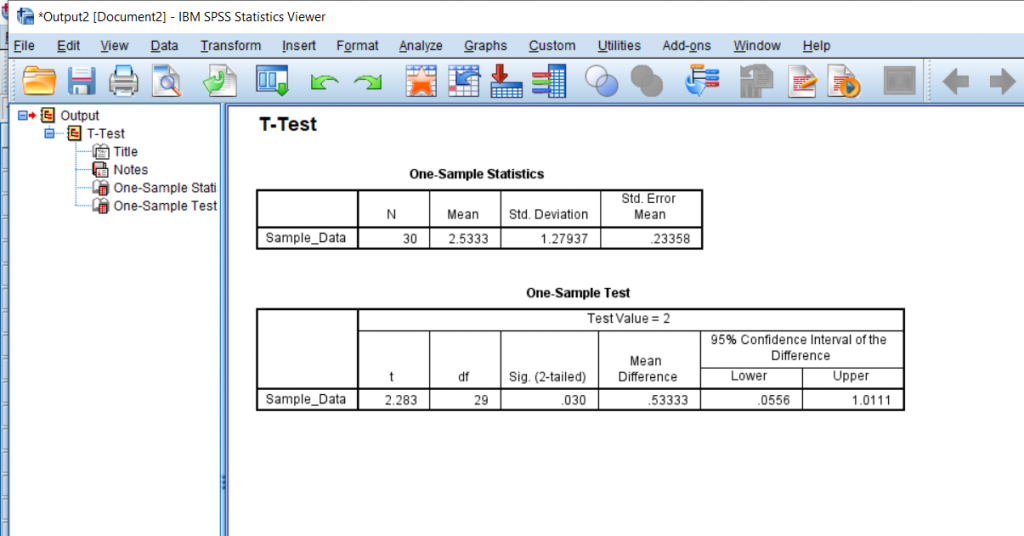
This is what my output ended up looking like. In the first row of boxes, N is the number of data points you have. In the second row of boxes, t is the t-statistic, df is the degrees of freedom, and Sig. is the p-value. The p-value will tell you if the difference is significant. Usually, we look for a p-value less than or equal to .05 before we state that the difference between the means is significant. In this case, the difference is significant.
This chapter was originally posted to the Math Support Center blog at the University of Baltimore on July 1, 2019.
