Lab 3 – Assignment
Your assignment for Lab 3:
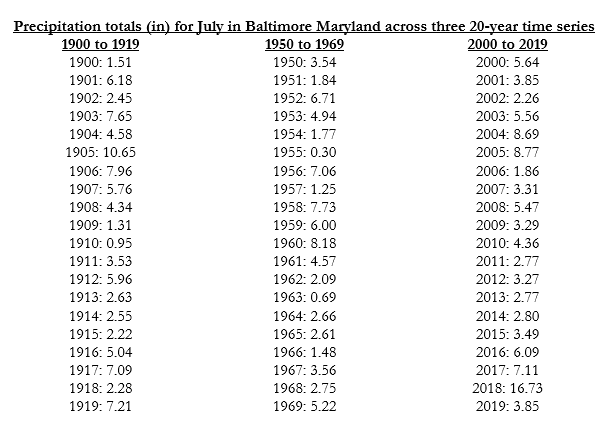
- Enter the Baltimore precipitation data (last page in this lab) into Excel
- Using Excel functions, determine the mean, median, range, mode, standard deviation, and standard error for each time series of your precipitation data, and highlight them in yellow in your spreadsheet so they are clearly visible.
- Create a graph that appropriately illustrates the differences between the three different time series of the precipitation data.
- Answer the following questions (type them directly into your Excel spreadsheet) using your summary statistics and your graph:
- Which time series had the year with the highest total of precipitation for July?
- Which time series had the year with the lowest total July precipitation?
- According to the EPA, Climate Change is predicted to increase both the number of droughts and the number of floods in Maryland. In other words, rainfall patterns will become more variable. Does your data set support this assertion from the EPA? Explain.
- Submit your Excel sheet with included summary statistics to the assignment on Sakai. Name your file “LASTNAME_FIRSTNAME_LAB3_BIO”