Using Excel: Lab 1, Part 2
In Lab 1, Part 2 we will work with formatting and analyzing data in Excel. Part 2 of the lab will compare the number of violent crimes in Baltimore between 2010 and 2016. All crime data is derived from the Uniform Crime Report (UCR) and the 2018 Baltimore Police Department Staffing Study Report. [1]
Part 2: Violent Crime in Baltimore
1. Download and open up the following Microsoft Excel worksheet: Lab 1 Part 2 Worksheet
2. Let’s examine how the amount of violent crime in total during the 2010–2016 timeframe and what percentage of the total was within each category.
3. To do this, first we will calculate the sum for each crime type across the 2010–2016 timeframe. Label cell B15 with the name Total per Crime.
a. To calculate the totals, we will create a formula in excel. These always start with an equal sign (=).
b. For a total, we will need to sum (or add) all of the numbers.
c. The formula is: =Sum(firstcell : last cell)—this formula will sum all of the numbers between the two cells in the column or row.
d. Type this formula into the Total cell for each government entity column.
e. For example, under Murder in cell C15, we will type: =Sum(C5 : C14).
f. Repeat this for Rape, Robbery, and Agg. Assault.
4. Next, create a new column title in G6 and call it Yearly Totals. Now, we will sum the totals for each year across the four crime types.
a. So, in cell G7, we will sum the four values for 2010 (be sure not to include the cell with the year in the formula!).
b. In cell G7, you should type: =Sum(C7 : F7)
c. You should then repeat this for each year. This may seem tedious, so shortcuts are available. When you copy a formula and paste it in a different cell, Excel applies this formula to equivalent cells in relation to the cell you are pasting in.
d. So, if we copy the formula from cell G7 (which is summing all the values in our Row 7), and paste it into G8, it will transfer the formula to equal the cells in row 8. Try the copy and paste shortcut to fill in the values for the rest of the years.
e. Finally, we want to calculate an overall total for the number of violent crimes in the entire 2010–2016 time span. Thus, you will be calculating the sum of the rows for each year. In cell G15, sum all of the yearly totals of G7–G13 to get a total value.
i. This gives us the total of the yearly totals.
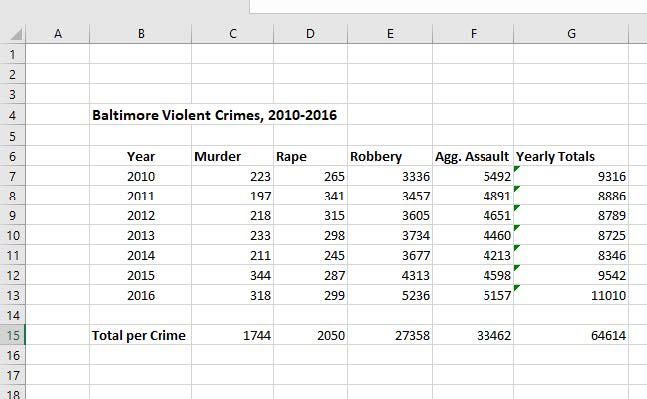
5. At this point, your worksheet should look like this:
6. Now, let’s calculate the percentage of the total number of violent crimes for each of the four crime types.
a. In row 16, cells C16–F16, use a formula to calculate the percentage from each column from the grand total of crime over the 2010–2016 time span. Thus, label cell B16 with the name % of total crime. The formula will be:

b. Use the cell reference in constructing the formula (example: =c15/g15*100) for each percentage you calculate.
i. **NOTE**You will not be able to cut and paste this formula across the rows, since G15 will be your denominator in each one and Excel will automatically replace it if you cut and paste the equation.
c. Thus, you must retype the formula for each percentage. Once you have calculated these percentages, decrease the number of decimals so you have one decimal place.
i. You can do this by going to the Number group under Home, find the button for decreasing the decimal place (called Decrease Decimal). Keep clicking on the button until no decimal place is displayed.
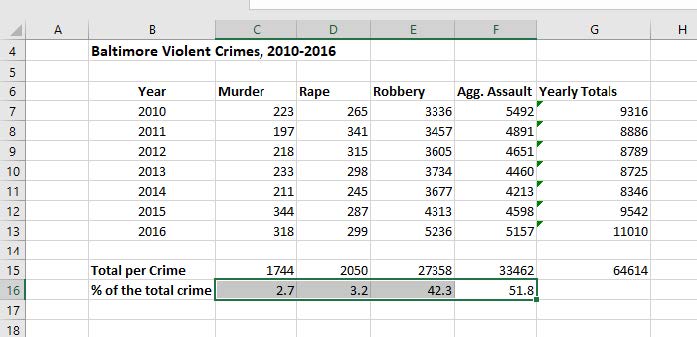
d. Below is what the final result of the table should look like. Check your numbers against the table to make sure it is accurate.
- More data and information on crime reporting by the FBI can be found at: https://www.fbi.gov/services/cjis/ucr/ ↵
